
River and stream flows
We have dozens of automatic water level gauges on rivers and streams at important locations throughout the Grand River watershed.
The information from the gauges is relayed to our head office and used to update the charts shown in this section of the website. They are updated every hour, usually around the half-hour.
These gauges are an important part of our flood forecasting and warning systems. They give our flood managers real-time information on changes in flows so they can issue flood messages to municipal flood co-ordinators and the public.
The gauges have automatic alarms that are triggered by a sudden change in water levels. A heavy, localized rainstorm or an ice jam might trigger an alarm.
The flows charts are also useful to recreational river users such as anglers, canoers and others.
How to read the charts
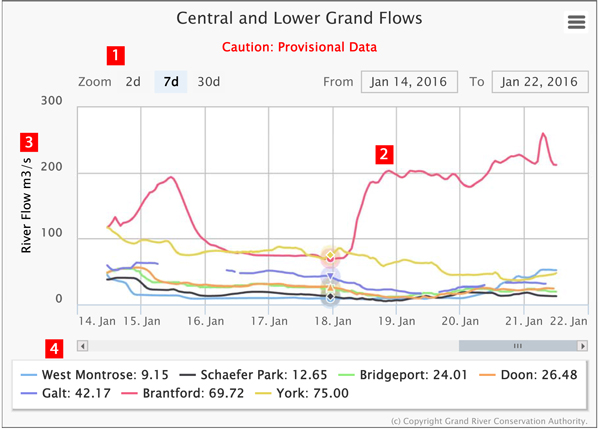
- Select a time frame: two days, seven days or 30 days
- Put your cursor on a line to see the flows at that specific time. The rate of flow shows next to the name of the gauge.
- Flows are measured in cubic meters per second, i.e. the amount of water flowing past a spot in a second. A cubic metre is 1,000 litres of water. These numbers on this side of the chart (the 'y' axis) change depending on the range of flows in this watercourse.
- The coloured line next to the name of the gauge matches the line on the chart. You can show and hide each gauge by clicking on the name.
Accuracy
A number of factors influence the accuracy of the charts including:
- backwater from ice, weeds or debris,
- malfunctioning equipment and/or routine maintenance of equipment that causes data spikes, and
- sediment accumulation plugging the gauge intake.
For more information read our Provisional Data page.
Contact Us
Grand River Conservation Authority
400 Clyde Road, PO Box 729
Cambridge, ON
N1R 5W6
Phone: 519-621-2761
Toll Free: 1-866-900-4722
grca@grandriver.ca